
ESCAPE POVERTY
AI CHART SCANNER
UPLOAD YOUR CHART. FIND THE SETUP.
Analyze your trading charts with AI-powered technical analysis using SMC, ICT, CRT, Swing and Scalp strategies.
AI analysis is for educational and informational purposes only and is not financial advice. Trading involves risk.
PRODUCT PREVIEW
SEE THE SCANNER IN ACTION
Explore clearly labelled examples of the structured output available from the existing scanner.
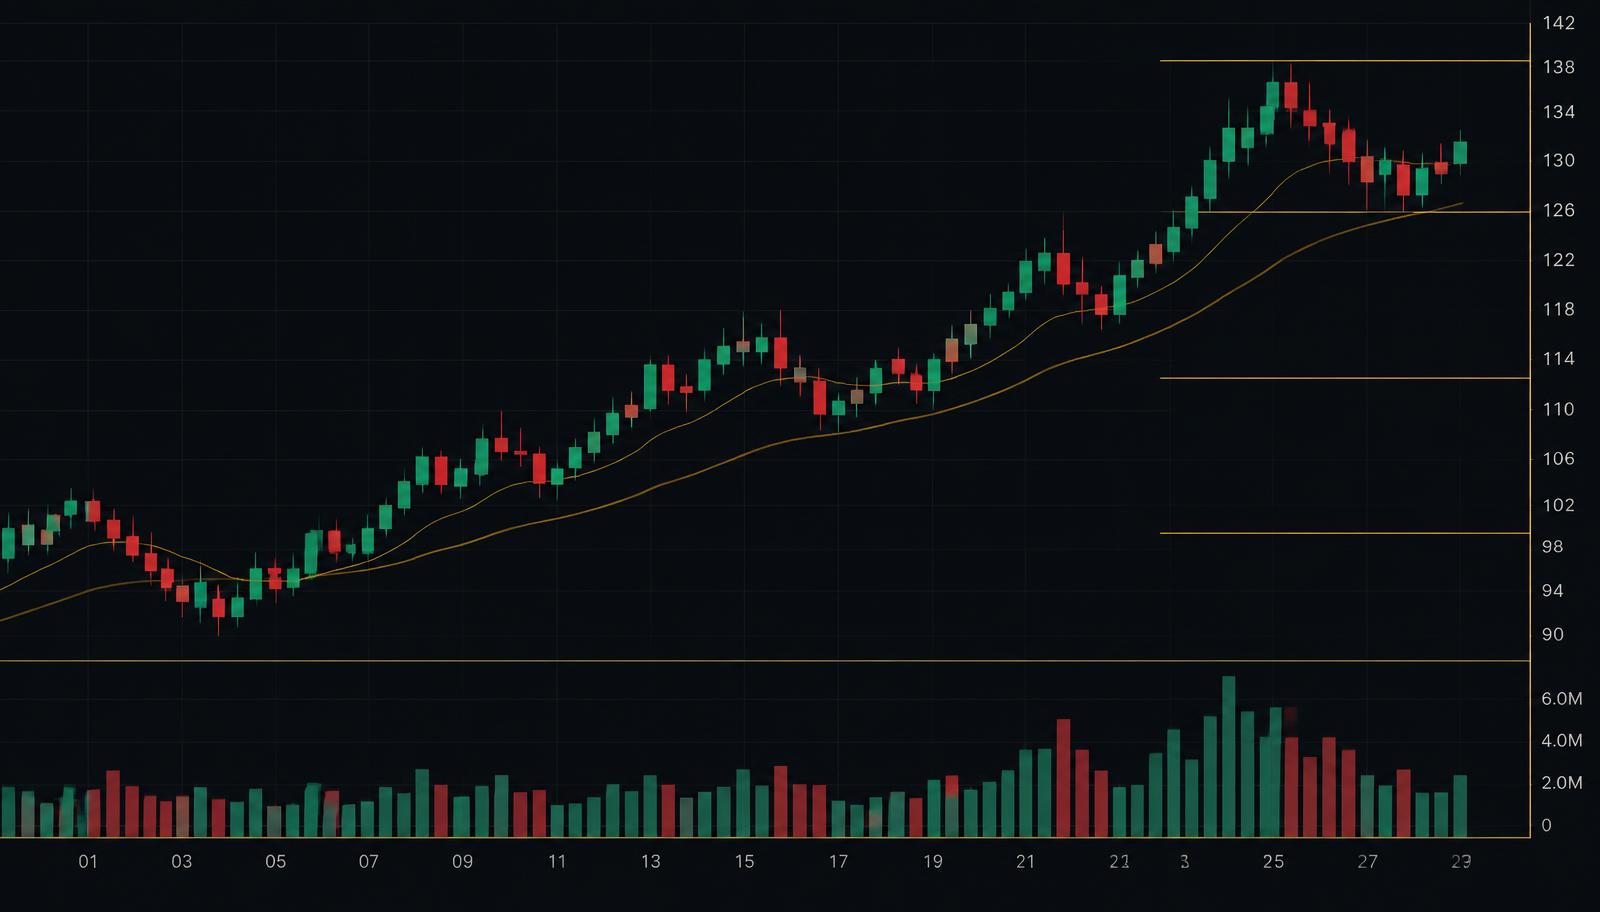
MARKET
XAUUSD
TIMEFRAME
15M
STRATEGY
SMC
- MARKET STRUCTURE
- Bullish continuation
- LIQUIDITY
- Sell-side sweep below the recent range
- ANALYSIS
- Price reclaimed the range with displacement and is holding above the break.
- POTENTIAL SETUP
- Potential retracement into the highlighted demand area, subject to confirmation.
Example data for product demonstration only
FROM CHART TO ANALYSIS
Upload your own screenshot and receive AI-assisted observations based only on what is visible in the chart.
BEFORE · UPLOADED CHART
AFTER · AI-ASSISTED ANALYSIS
Annotations highlight areas referenced by the analysis. They are observations, not certain predictions.
SCREENSHOT ANALYSIS
Upload PNG, JPG or WEBP. The AI reads what is visible on your chart.
SMART MONEY CONCEPTS
Potential BOS, CHOCH, order blocks, fair value gaps and liquidity zones.
STRUCTURED OUTPUT
Market structure, bias, potential entry, stop-loss and take-profit areas.
NO LIVE MARKET DATA
No broker APIs, no feeds, no fake prices — only your uploaded image.
COMMUNITY
WHAT OUR COMMUNITY IS SAYING 🔥
Shared in our own words. Individual experiences — not a promise of profits.
“I love this scanner because it show me easy setups 🔥🔥”
“Which one is this one 🔥🔥🫱🏽🫲🏼”
“Never see this much profits in a day W ESCAPE POVERTY 🔥🔥🫱🏽🫲🏼🛜”
“Best in business 🔥⚠️”
“This scanner is on something else it always showing flams 🔥🔥🔥🔥😭”
UPLOAD → AI ANALYZES → STRUCTURED CHART ANALYSIS
Choose your analysis strategy — SMC, ICT, CRT, Swing or Scalp — upload your screenshot and receive a clear read on structure, liquidity, momentum and potential setups.
FOUNDER'S REAL SCANS · XAUUSD M5 · 27 OCT 2026
ONE REAL TRADING DAY
Screenshots from the founder's own account, trading gold from scanner results. This is one day, not a measured win rate.
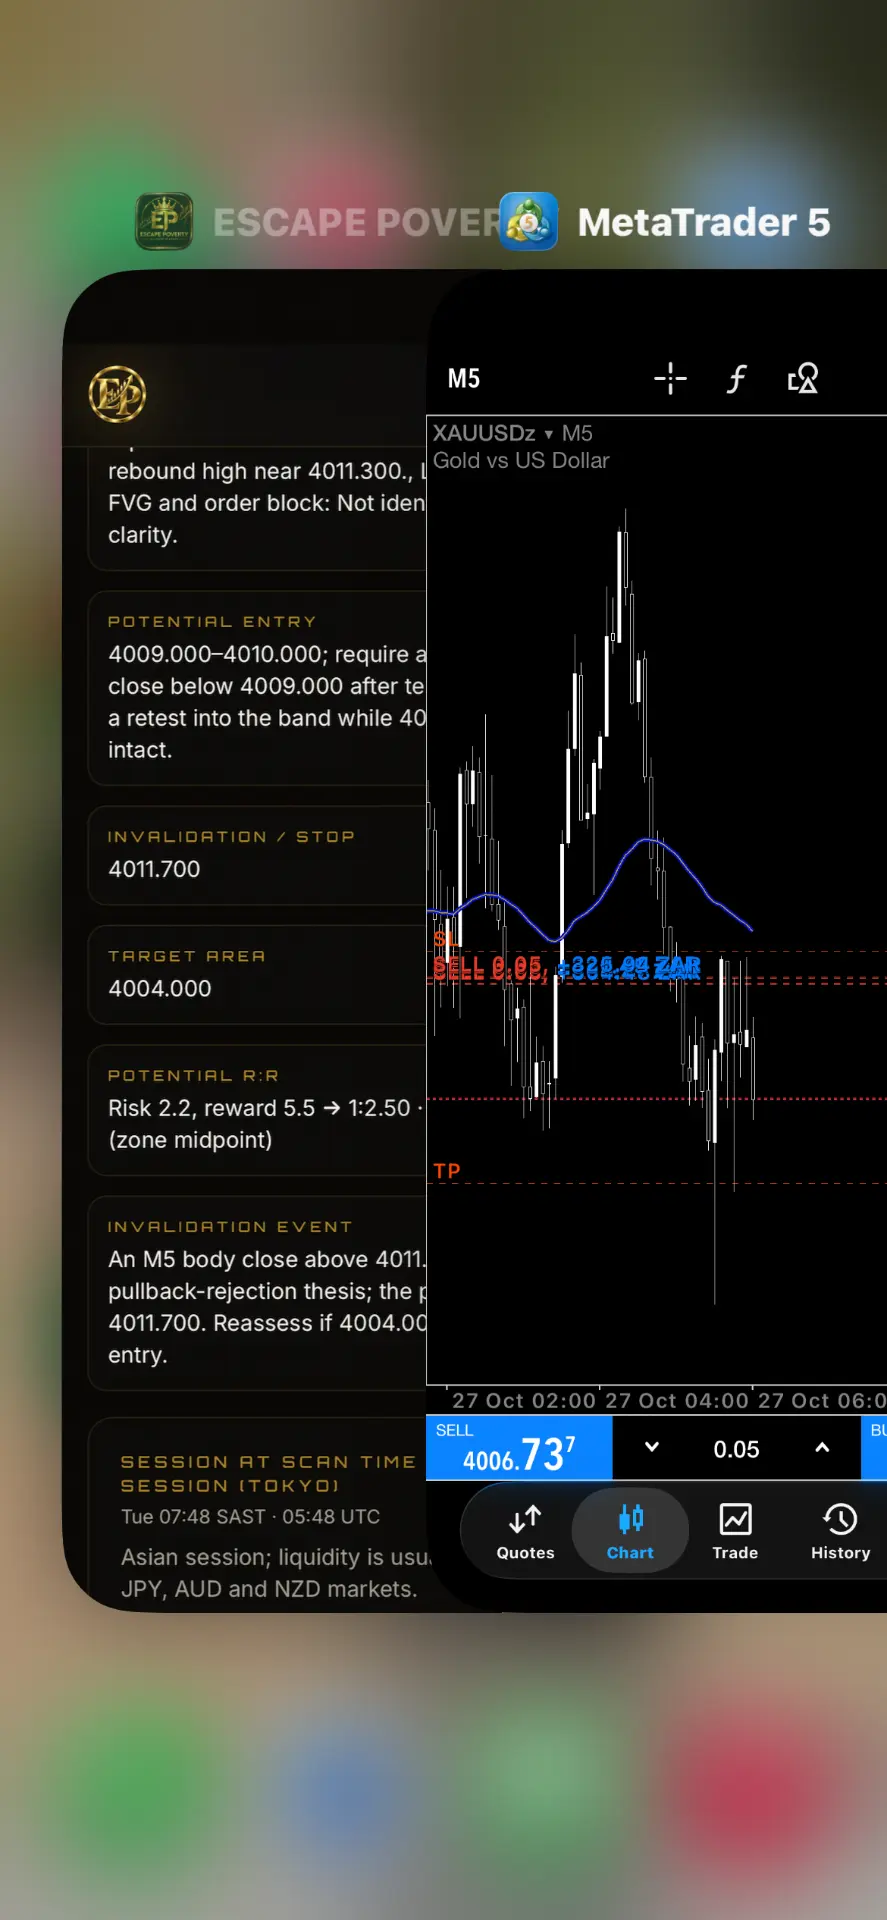
Tokyo session · Sell
Scanner call: sell 4009–4010, stop 4011.70, target 4004.00 (1:2.50).
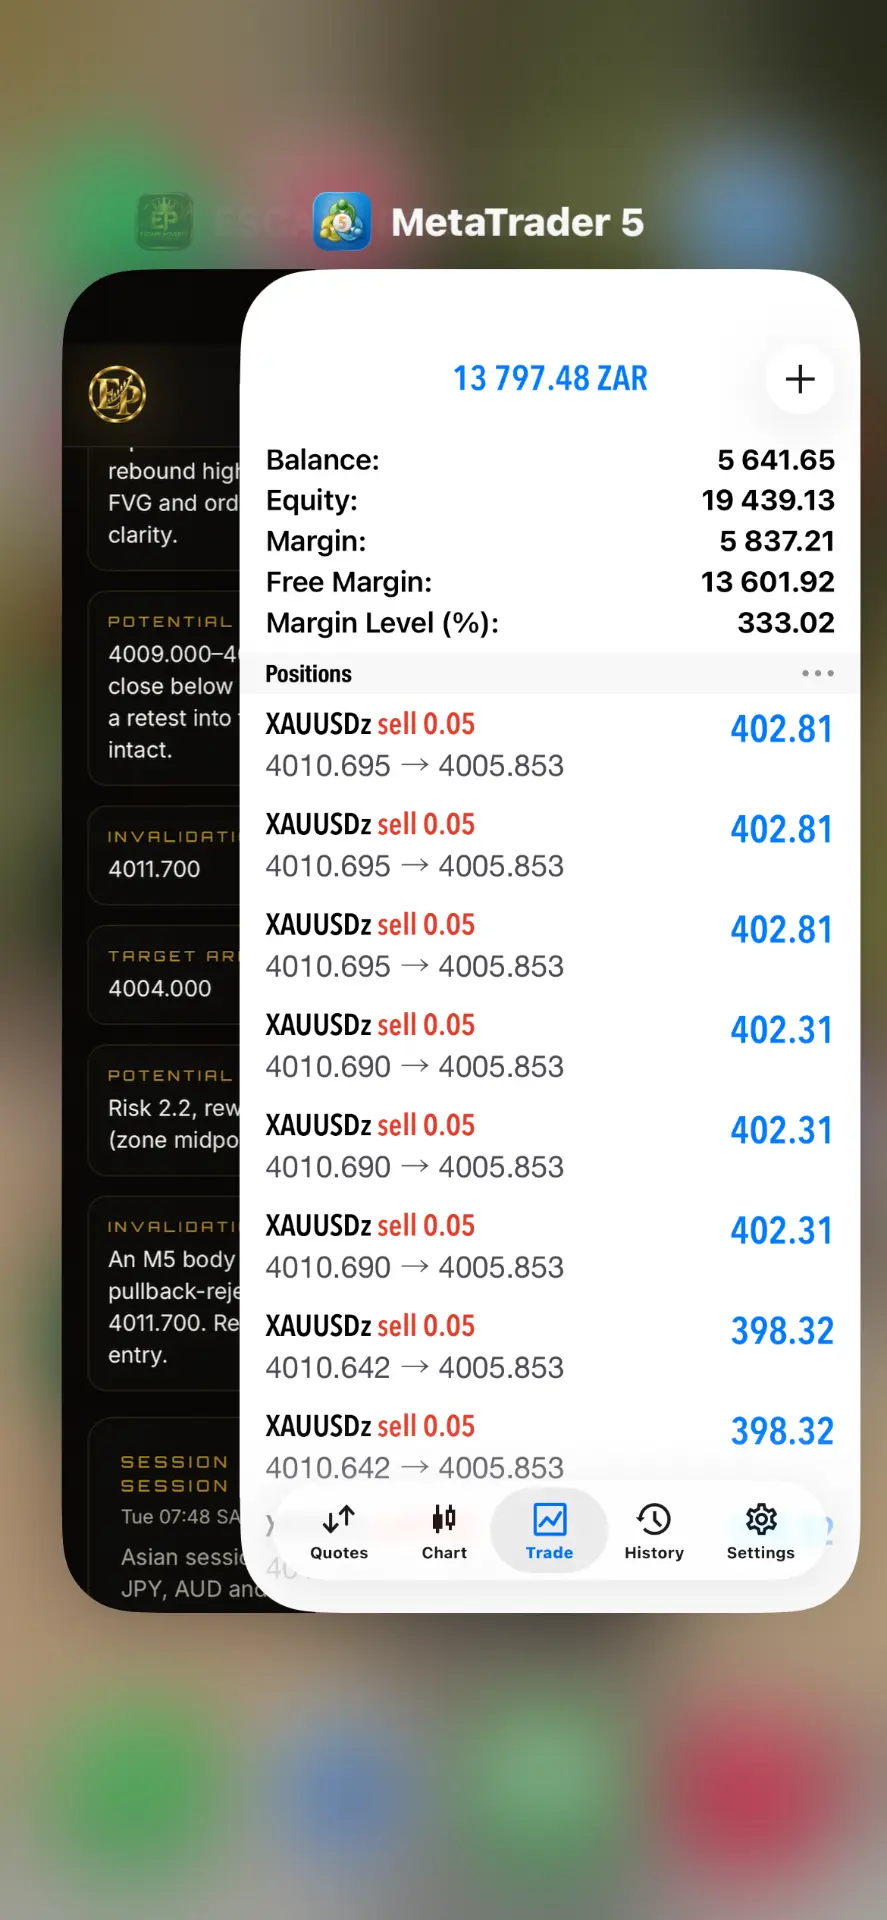
Trade running
Sells opened from the scanner's entry area, moving towards the target.
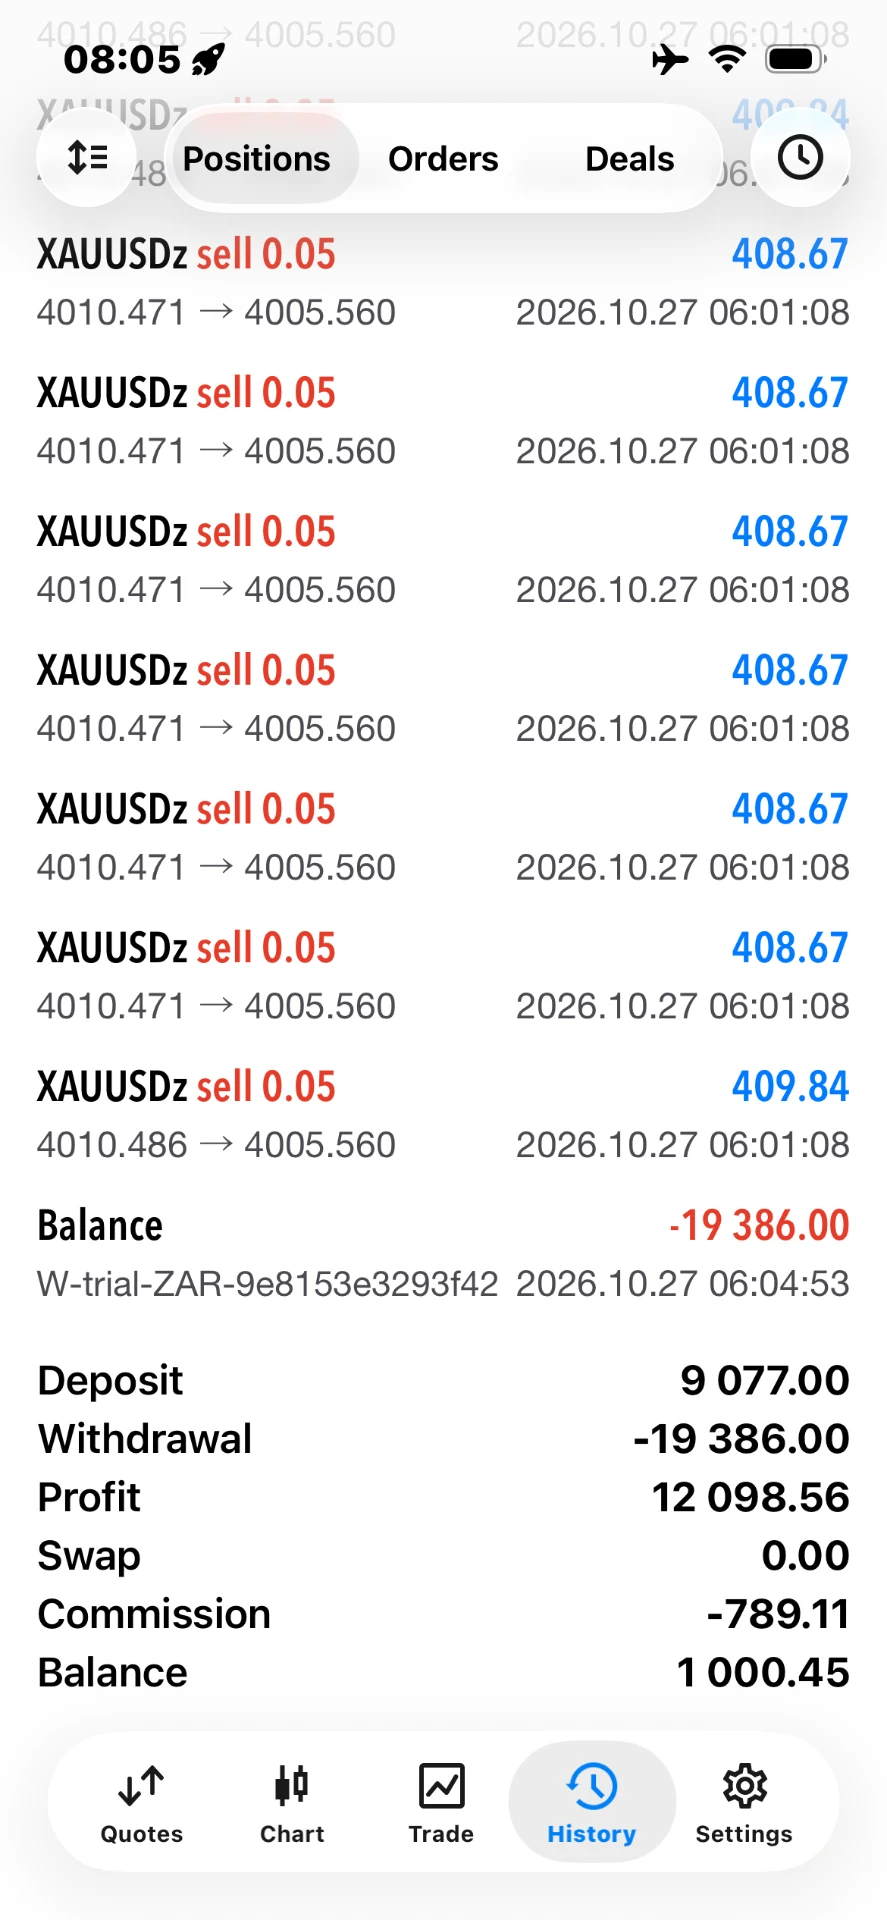
Closed in profit
Closed at 4005.56 before the full target, about R408 per 0.05 lot.
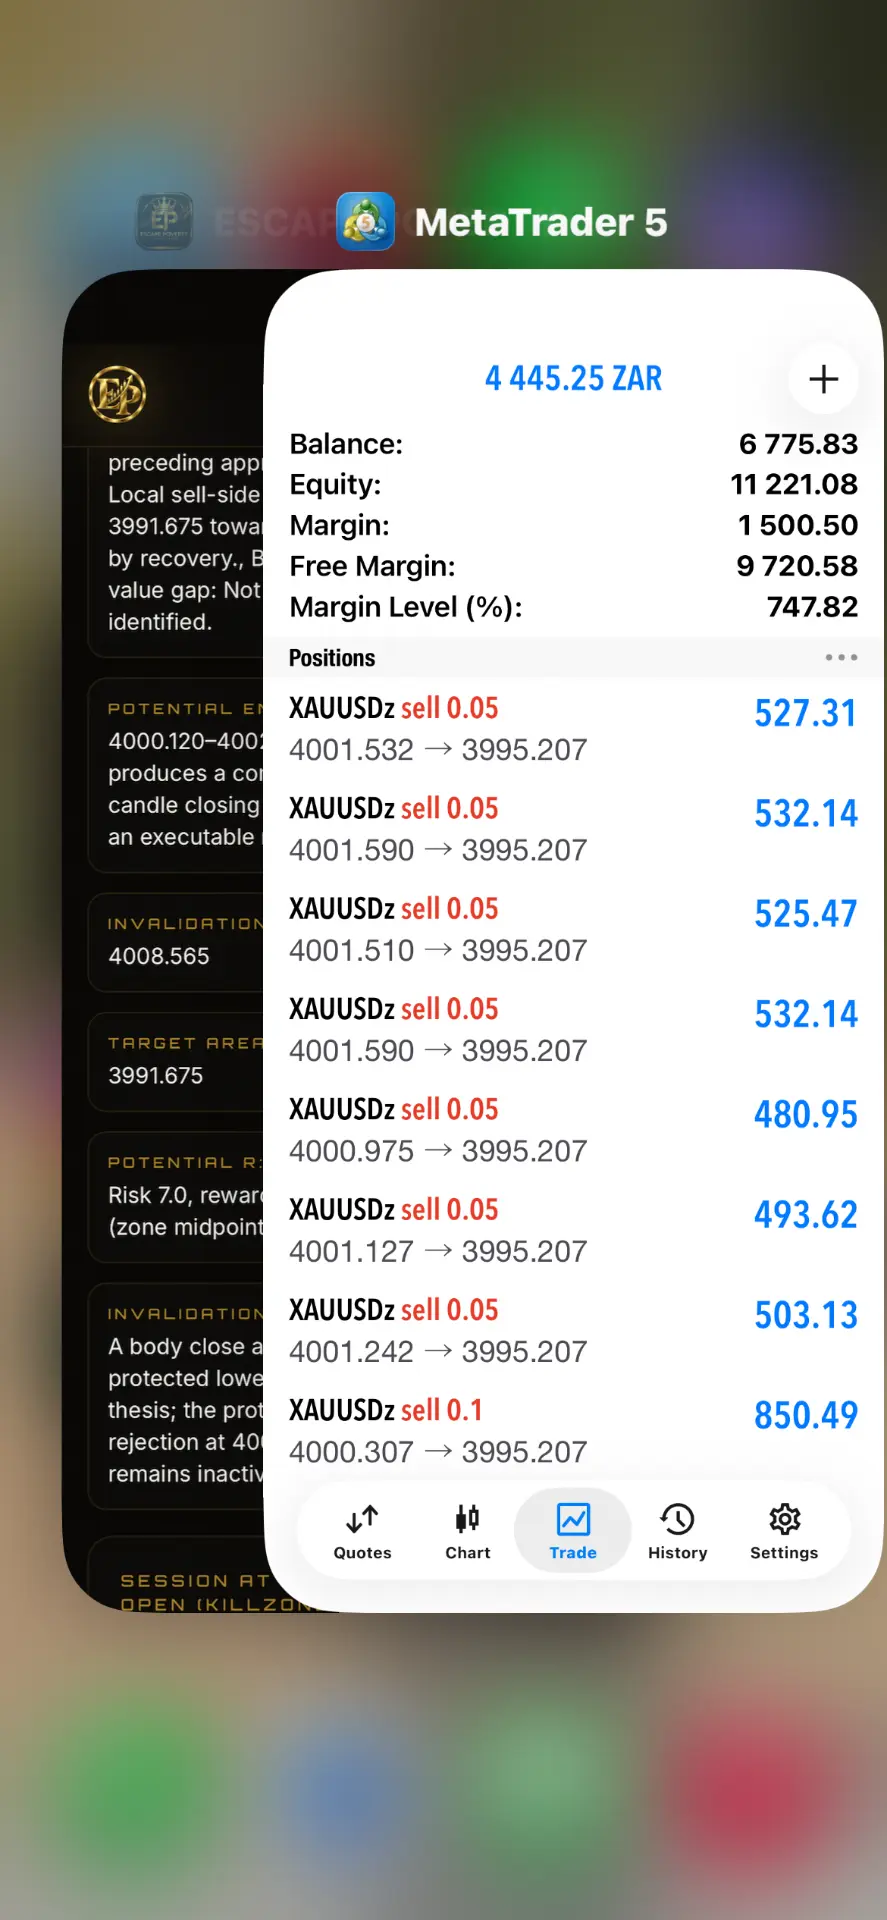
London open · Sell
Scanner call: sell 4000.12–4002, stop 4008.57, target 3991.68.
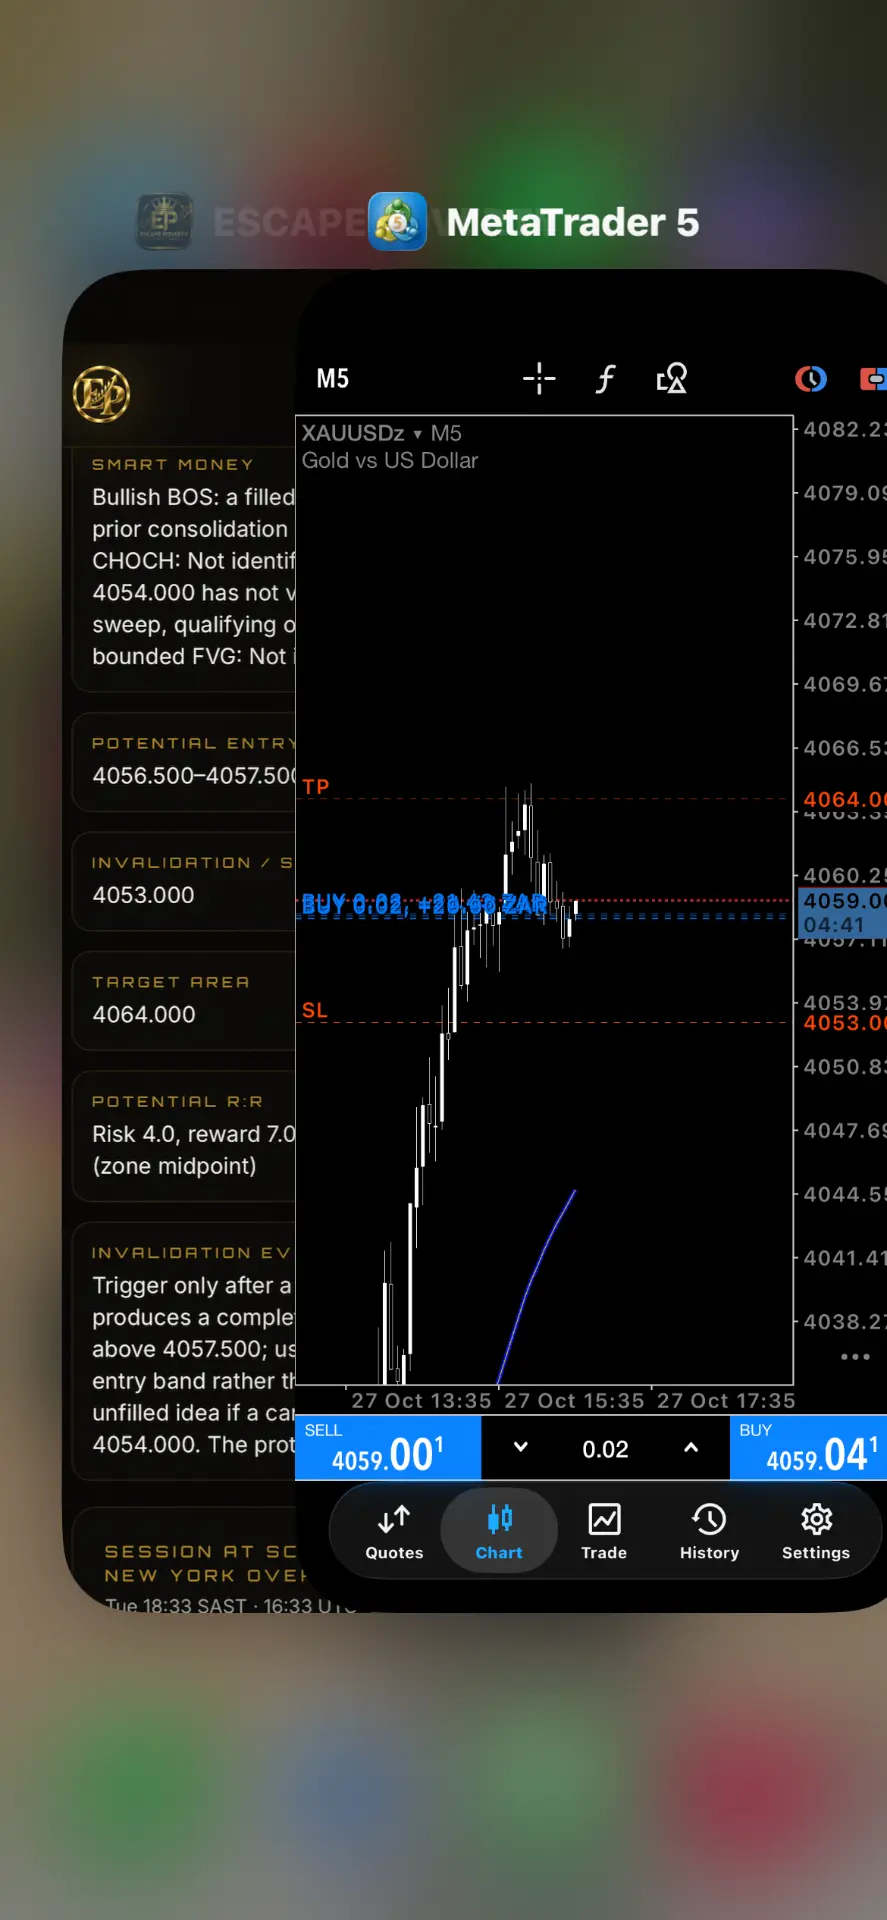
New York overlap · Buy
Scanner call: buy 4056.50–4057.50, stop 4053, target 4064. Shown while open.
Founder's own trades, not customer reviews. Past results do not guarantee future results. Trading carries a high risk of loss.
LATEST UPDATES
BUILT FOR CLEARER CHART REVIEW
Recent improvements already available inside the product.
SUPPORT
NEED HELP?
Get help with access, payment, or using the scanner.