
FOR GOLD & NAS100 TRADERS

A SECOND OPINION ON YOUR XAUUSD & NAS100 CHARTS

Upload a chart screenshot. The AI Chart Scanner reads its structure, liquidity and key levels using the strategy you trade.

No card needed for the free plan.
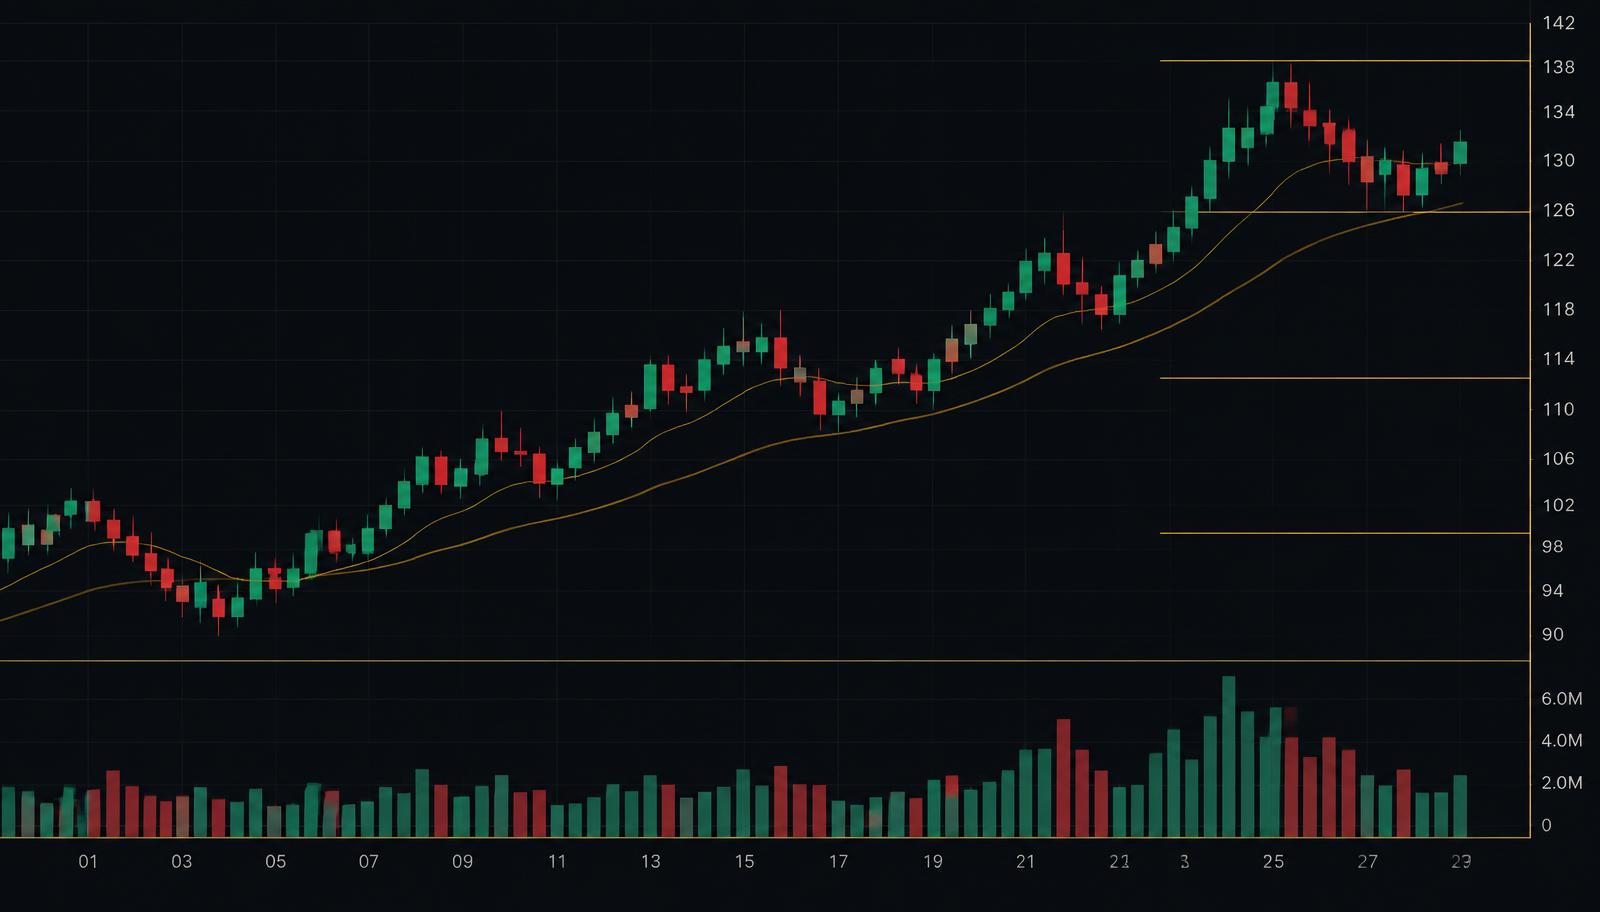
DEMO ANALYSIS
XAUUSD fictional demonstration chart
LIQUIDITY AREA
AREA OF INTEREST

MARKET

XAUUSD

TIMEFRAME

15M

STRATEGY

SMC

MARKET STRUCTURE
Bullish continuation
LIQUIDITY
Sell-side sweep below the recent range
ANALYSIS
Price reclaimed the range with displacement and is holding above the break.
POTENTIAL SETUP
Potential retracement into the highlighted demand area, subject to confirmation.

Example data for product demonstration only

STEP 1

Screenshot your chart

Any platform. Keep the price scale visible.

STEP 2

Pick a strategy

SMC, ICT, CRT, Swing or Scalp.

STEP 3

Read the analysis

Structure, bias, liquidity and the reasons behind it.

WHAT THE SCANNER CHECKS

  • Reads the swing highs and lows on your XAUUSD or NAS100 screenshot
  • Checks structure breaks, liquidity sweeps and fair value gaps
  • Five strategy modes: SMC, ICT, CRT, Swing and Scalp
  • Says NO CLEAR SETUP when the chart doesn't support one
  • Shows the trading session at scan time and upcoming NFP, CPI and FOMC risk

The scanner analyses static screenshots only. It does not connect to a broker, place trades or predict prices, and no result is a guarantee. AI analysis is for educational and informational purposes only and is not financial advice. Trading involves risk.